The The mplot3d toolkit can be used as an add-on to matplotlib for simple 3D plots and charts. In addition, the interactive backends enable rotating and zooming the 3D graphs.
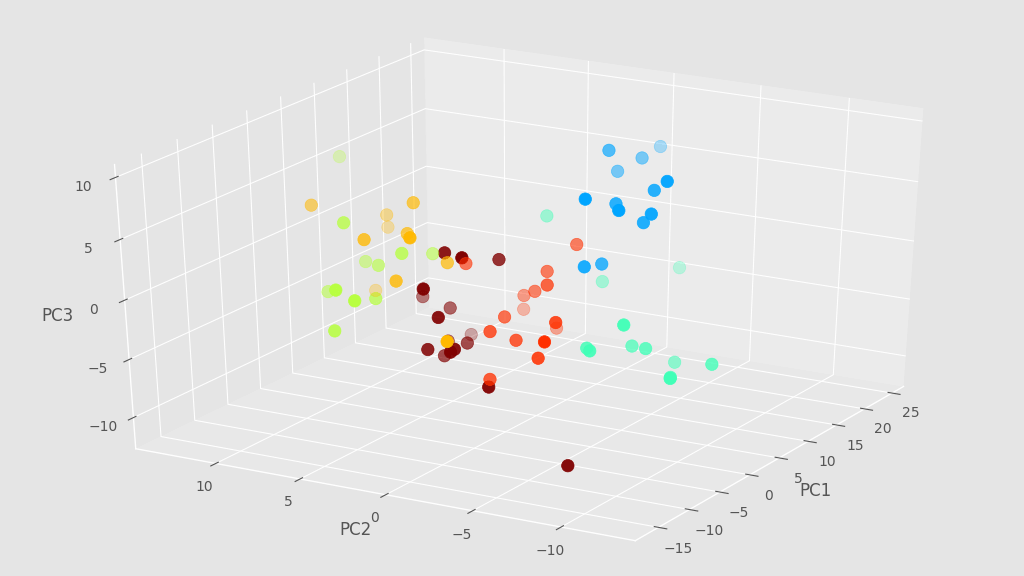
Here we show how to make a very simple animation of a 3D scatter plot using the mplot3d toolkit.
In this example we are going to use data derived by Principal Components Analysis (PCA) applied to near-infrared (NIR) spectra of different samples. NIR spectra contains hundreds of data points, which can be reduced to just a handful by PCA.
Today we are going to start with a set of data point stored in a numpy array X which contains the coordinates of the first 3 principal components worked out by PCA. For instance the first 5 points of the array X would look like this:
array([[-2.387369  , -5.37056941,  8.78933234],
       [-3.27891755, -5.67361897,  3.61089993],
       [ 0.91674654, -5.16642442,  2.64881256],
       [ 3.38976338, -5.04415541,  6.92688102],
       [-1.7956064 , -7.01851776,  8.10397704]])
Associated with X we have an array of labels, simply numbers referring to some classification of the sample measured. We will use the labels to color code the points of our scatter plot.
OK, without further ado let’s write the imports we need for the graph:
import matplotlib.pyplot as plt
from mpl_toolkits.mplot3d import Axes3D
And here’s how we make the plots. The idea is to generate and save plots by changing the view angle every time.
# Extract unique labels
unique = list(set(labels))
# Define the colors
colors = [plt.cm.jet(float(i+1)/(max(unique)+1)) for i in unique]

# Define plot style
with plt.style.context(('ggplot')):

    # Loop over the view angles
    for angle in range(0,360,5):

        # Define figure and 3D axes
        fig = plt.figure(figsize=(10,7))
        ax = Axes3D(fig)

        # Loop over every element of X
        for i, u in enumerate(unique):
            xi = [X[j,0] for j  in range(len(X[:,0])) if lab[j] == u]
            yi = [X[j,1] for j  in range(len(X[:,1])) if lab[j] == u]
            zi = [X[j,2] for j  in range(len(X[:,2])) if lab[j] == u]

            # Scatter plot
            ax.scatter(xi, yi, zi, c=colors[i], s=80, label=str(u))

        # Set the view angle
        ax.view_init(30, angle)

        # Label the axes
        ax.set_xlabel('PC1')
        ax.set_ylabel('PC2')
        ax.set_zlabel('PC3')

        # Save the figure
        plt.savefig('.\\movie\\t4_'+str(angle).zfill(3)+'.png', dpi=100)
Here’s how one of the frames looks like.

That’s it for today. Feel free to send us comments or suggestions using the box below. Thanks for stopping by!
| Cookie | Duration | Description |
|---|---|---|
| cookielawinfo-checkbox-analytics | 11 months | This cookie is set by GDPR Cookie Consent plugin. The cookie is used to store the user consent for the cookies in the category "Analytics". |
| cookielawinfo-checkbox-functional | 11 months | The cookie is set by GDPR cookie consent to record the user consent for the cookies in the category "Functional". |
| cookielawinfo-checkbox-necessary | 11 months | This cookie is set by GDPR Cookie Consent plugin. The cookies is used to store the user consent for the cookies in the category "Necessary". |
| cookielawinfo-checkbox-others | 11 months | This cookie is set by GDPR Cookie Consent plugin. The cookie is used to store the user consent for the cookies in the category "Other. |
| cookielawinfo-checkbox-performance | 11 months | This cookie is set by GDPR Cookie Consent plugin. The cookie is used to store the user consent for the cookies in the category "Performance". |
| viewed_cookie_policy | 11 months | The cookie is set by the GDPR Cookie Consent plugin and is used to store whether or not user has consented to the use of cookies. It does not store any personal data. |